Elliot Wave for Eur/Jpy

It's been a while since i post here. Picture above is my prediction for coming trading session. Right now, all i see is a correction move and EJ will bee retesting support become resistant @ 129.5/130. Also nice pin bar @ monthty is reforming. With Euro fundamental is a bit sluggish & also last time Trichet spoke, he hint that ECB will decrease rate. I do not sure but i think market is position the price as we speak.
So, at this point, im scalping along the way to 129.5/130 with small position and ready to add some of my short position maybe next week if we see 129.5 reach. Target is already there @ 100% fibo expansion @ 121.83. By then, we'll see if what US done for now which is printing money all over & their bullshit coverup debt can make sentiment turn bullish again. I also noted that daily candle is a bullish sign for long term curenncy vs Jpy. We'll see in the next 3rd or 4th quarter if the bullish sign coming up.
That's all for now folks.
Friday, April 24, 2009 |
0 Comments
![]()
![]()
![]()
![]()
![]()
![]()
![]()
Paulson Testimony on Turmoil in U.S. Credit Markets
Testimony by Secretary Henry M. Paulson, Jr.
before the Senate Banking Committee
on Turmoil in US Credit Markets: Recent Actions regarding
Government Sponsored Entities, Investment Banks and
other Financial Institutions
Washington, DC--Chairman Dodd, Senator Shelby, members of the committee, thank you for the opportunity to appear before you today. I appreciate that this is a difficult period for the American people. I also appreciate that Congressional leaders and the Administration are working closely together so that we can help the American people by quickly enacting a program to stabilize our financial system.
We must do so in order to avoid a continuing series of financial institution failures and frozen credit markets that threaten American families' financial well-being, the viability of businesses both small and large, and the very health of our economy.
The events leading us here began many years ago, starting with bad lending practices by banks and financial institutions, and by borrowers taking out mortgages they couldn't afford. We've seen the results on homeowners – higher foreclosure rates affecting individuals and neighborhoods. And now we are seeing the impact on financial institutions. These bad loans have created a chain reaction and last week our credit markets froze – even some Main Street non-financial companies had trouble financing their normal business operations. If that situation were to persist, it would threaten all parts of our economy.
As we've worked through this period of market turmoil, we have acted on a case-by-case basis --- addressing problems at Fannie Mae and Freddie Mac, working with market participants to prepare for the failure of Lehman Brothers, and lending to AIG so it can sell some of its assets in an orderly manner. We have also taken a number of powerful tactical steps to increase confidence in the system, including a temporary guaranty program for the U.S. money market mutual fund industry. These steps have been necessary but not sufficient.
More is needed. We saw market turmoil reach a new level last week, and spill over into the rest of the economy. We must now take further, decisive action to fundamentally and comprehensively address the root cause of this turmoil.
And that root cause is the housing correction which has resulted in illiquid mortgage-related assets that are choking off the flow of credit which is so vitally important to our economy. We must address this underlying problem, and restore confidence in our financial markets and financial institutions so they can perform their mission of supporting future prosperity and growth.
We have proposed a program to remove troubled assets from the system. This troubled asset relief program has to be properly designed for immediate implementation and be sufficiently large to have maximum impact and restore market confidence. It must also protect the taxpayer to the maximum extent possible, and include provisions that ensure transparency and oversight while also ensuring the program can be implemented quickly and run effectively.
The market turmoil we are experiencing today poses great risk to US taxpayers. When the financial system doesn't work as it should, Americans' personal savings, and the ability of consumers and businesses to finance spending, investment and job creation are threatened.
The ultimate taxpayer protection will be the market stability provided as we remove the troubled assets from our financial system. I am convinced that this bold approach will cost American families far less than the alternative – a continuing series of financial institution failures and frozen credit markets unable to fund everyday needs and economic expansion.
Over these past days, it has become clear that there is bipartisan consensus for an urgent legislative solution. We need to build upon this spirit to enact this bill quickly and cleanly, and avoid slowing it down with other provisions that are unrelated or don't have broad support. This troubled asset purchase program on its own is the single most effective thing we can do to help homeowners, the American people and stimulate our economy.
Earlier this year, Congress and the Administration came together quickly and effectively to enact a stimulus package that has helped hard-working Americans and boosted our economy. We acted cooperatively and faster than anyone thought possible. Today we face a much more challenging situation that requires bipartisan discipline and urgency.
When we get through this difficult period, which we will, our next task must be to address the problems in our financial system through a reform program that fixes our outdated financial regulatory structure, and provides strong measures to address other flaws and excesses. I have already put forward my recommendations on this subject. Many of you also have strong views, based on your expertise. We must have that critical debate, but we must get through this period first.
Right now, all of us are focused on the immediate need to stabilize our financial system, and I believe we share the conviction that this is in the best interest of all Americans.
Thank you.
Wednesday, September 24, 2008 |
0 Comments
![]()
![]()
![]()
![]()
![]()
![]()
![]()
Daily Forex Signal
Status - 1.7700 +200 pips.
2- Forex signal for gbp/jpy - Buy @ 186.85
Status - Closed @ 190.50 +365 pips.
3- Forex signal for aud/usd - Buy @ 0.7950
Status - Closed @ 0.8100 +150 pips.
4- Forex signal for aud/jpy - Buy @ 84.70
Status - Closed @ 87.00 +230 pips.
5- Forex signal for eur/usd - Buy @ 1.3920
Status - Closed @ 1.4100 +180 pips.
6- Forex signal for eur/jpy - Buy @ 148.75
Status - Closed @ 151.75 +300 pips.
Total = +1425 pips.
Friday, September 12, 2008 |
0 Comments
![]()
![]()
![]()
![]()
![]()
![]()
![]()
Daily Forex Signal & Analysis
Focus today is news in US session. WE have Core Retail Sales m/m, PPI m/m, Retail Sales m/m and Core PPI m/m in 20:30 gmt +8. Census Bureau will release Core Retail Sales m/m & Retail Sales m/m and Department of Labor will release PPI m/m & Core PPI m/m. We might see some nasty volatile movement before and after the news release.
For Core Retail Sales m/m, market is expect data to be lower at -0.2% vs 0.4%. However, for Retail Sales m/m, market is expect data to be higher at 0.2% vs -0.1%. Below is data history for previous 3 month:
 Core Retail Sales m/m history
 Core PPI m/m history
 Prelim UoM Consumer Sentiment history
1- Forex signal for gbp/usd - Buy @ 1.7500
Status - Open
2- Forex signal for gbp/jpy - Buy @ 186.85
Status - Open
3- Forex signal for aud/usd - Buy @ 0.7950
Status - Open
4- Forex signal for aud/jpy - Buy @ 84.70
Status - Open
5- Forex signal for eur/usd - Buy @ 1.3920
Status -Open
6- Forex signal for eur/jpy - Buy @ 148.75
Status -Open
Friday, September 12, 2008 |
0 Comments
![]()
![]()
![]()
![]()
![]()
![]()
![]()
Daily Forex Signal
Status - Closed @ 1.7450 +70 pips.
2- Forex signal for gbp/usd - Buy @ 1.7450
Status - Closed @ 1.7575 +125 pips.
3- Forex signal for gbp/jpy - Sold @ 188.60
Status - Closed @ 185.00 +360 pips.
4- Forex signal for gbp/jpy - Buy @ 185.00
Status - Closed @ 188.00 +300 pips.
Thursday, September 11, 2008 |
0 Comments
![]()
![]()
![]()
![]()
![]()
![]()
![]()
Daily Forex Signal & Analysis
GBP/JPY on the other hand, open below pivot 188.91. Base on the RSI daily, we can see this pair is oversold already. Maybe we can see some consolidation retesting resistant and support for the rest of this week. MACD is below 0 and RSI is below 50. At this time, with low volume, i dont want to guess where this beast might go. Will have to wait untill enough evidence if i want to execute a position.
AUD/JPY is also open below pivot level which is 86.54 and EUR/JPY is also open below pivot @ 151.71. I dont want to assume anymore cause i had a bad experiences in the past. Will have to wait untill more volume in euro/london session. Maybe today i will scalp here & there if i see good movement in 5M timeframe. That's all for today folks.
Wednesday, September 10, 2008 |
0 Comments
![]()
![]()
![]()
![]()
![]()
![]()
![]()
Daily Forex Signal & Analysis
I like to focus today with BRC Retail Sales Monitor y/y, RICS House Price Balance, Home Loans m/m and Retail Sales m/m in asian session. Look like that pound has showed some strengh yesterday, following last week NFP weak data. British Retail Consortium will release BRC Retail Sales Monitor y/y data in a few hours. Also RICS will release RICS House Price Balance data for UK at 07:01 gmt +8. Below is history for the past 3 months for the upcoming uk data:
 Retail Sales m/m history
 Pending Home Sales m/m history
1- Forex signal for gbp/usd - Buy @ 1.7540
Status - Closed @ 1.7640 +100 pips.
2- Forex signal for gbp/jpy - Buy @ 189.30
Status - Closed @ 190.50 +120 pips.
3- Forex signal for aud/usd - Buy @ 0.8130
Status - Closed @ 0.8170 +40 pips.
4- Forex signal for aud/jpy - Buy @ 87.80
Status - Closed @ 88.30 +50 pips.
Tuesday, September 09, 2008 |
0 Comments
![]()
![]()
![]()
![]()
![]()
![]()
![]()
Daily Forex Signal and Analysis.
From my experiences, i think this a good signal for trend changing. Maybe, give me some hint that wave 3 (Elliot wave) is in beginning mode in crossing @ vs yen pair. Will have to pay more intention in this one. That's all for today folks.
Hint: You all can see that 30m chart is retesting lwma 200 in all crossing pair.
Status - Closed @ 1.7810 +200 pips.
2- Forex signal for gbp/jpy - Buy @ 187.80
Status - Closed @ 193.80 +600 pips.
3- Forex signal for eur/jpy - Buy @ 152.00
Status - Closed @ 156.00 +400 pips
4- Forex signal for aud/jpy - Buy @ 86.50
Status - Closed @ 90.00 +350 pips.
Total - 1550 pips. Woohooo..
Monday, September 08, 2008 |
0 Comments
![]()
![]()
![]()
![]()
![]()
![]()
![]()
Daily Forex Signal and Analysis.
BTW, i like to focus in today events that i think is very important. In asian session, we have Trade Balance that concern AUD currency. But, i think i want to skip that. 16:00 gmt +8, we have Halifax HPI m/m. Market is expect data to lower than previous which is -1.8% vs previous -1.7%. But i personally think that untill NFP report release on friday, market will consolidate and maybe we can see some volatile retesting both medium term resistant and support. Below is Halifax HPI data history for previous month:
 Today in london session we have 2 banks that will release interest rate which is Bank of EnglandEuropean Central Bank. By the previous market sentiment and inflation data, i think both banks will keep rate the same. BOE will release data at 19:00 gmt +8 and ECB will release data at 19:45 gmt +8.
 European Central Bank previous history
 Institute for Supply Management will release ISM Non-Manufacturing PMI later at 22:00 gmt +8. Market is expect data to be lower than previous which is 49.4 forcast and 49.5 previous. Below is ISM Non-Manufacturing PMI previous history:
Status - Closed @ 1.7830 +100 pips.
2- Forex signal for gbp/jpy - Buy @ 191.75
Status - Closed @ 193.00 +125 pips.
3- Forex signal for eur/usd - Buy @ 1.4470
Status - Closed @ 1.4520 +50 pips
4- Forex signal for eur/jpy - Buy @ 156.70
Status - Closed @ 157.50 +80 pips.
Thursday, September 04, 2008 |
0 Comments
![]()
![]()
![]()
![]()
![]()
![]()
![]()
Daily Forex Signal

 In US session, i like to focus at important news that will be release at 21:00 gmt +8 which is BOC interest rate statement. With the current economic events in canada and previous inflation data, i think Bank of Canada will not cut or raise the current rate which is at 3.00% now. But i will pay close intention in the statement. Below is data history for previous month:
 1- Forex signal for aud/usd - Sold @ 0.8390
 Status - Close @ 0.8250 +140 pips.
2- Forex signal for aud/jpy - Sold @ 91.20
Status - Close @ 90.00 +120 pips.
3- Forex signal for gbp/usd - Sold @ 1.7820
Status - Close @ 1.7720 +100 pips.
4- Forex signal for gbp/jpy - Sold @ 193.90
Status - Close @ 192.50 +140 pips.
5- Forex signal for usd/cad - Sold @ 1.0685
Status - Close @ 1.0710 -25 pips.
Wednesday, September 03, 2008 |
0 Comments
![]()
![]()
![]()
![]()
![]()
![]()
![]()
Daily Forex Signal
Base on 3 month history, Building Approvals which is released by Australian Bureau of Statistics, last month data is -0.7% compare to -7.2%. Below is data history for previous month:

Tuesday, September 02, 2008 |
0 Comments
![]()
![]()
![]()
![]()
![]()
![]()
![]()
Daily Forex Signal
Status - Closed +100 pips.
2- Forex signal for gbp/jpy - Sold @ 196.58 tp @ 194.58.
Status - Closed +200 pips.
Monday, September 01, 2008 |
0 Comments
![]()
![]()
![]()
![]()
![]()
![]()
![]()
Tutorial - Double Top and Bottom
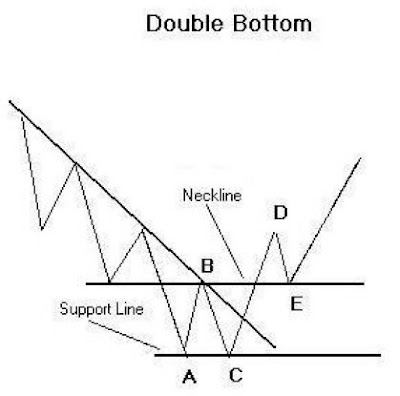
Double tops are sometimes called ''M's'' and double bottoms ''W's'', as the pattern
resembles each of these letters. Both are reversal patterns and the stronger the preceding trend the more important the reversal when it happens. My research indicated that double tops tend to be shorter in duration and the break down more pronounced. Double bottoms on the other hand tend to be longer in duration and the price action tends to be in a smaller range.
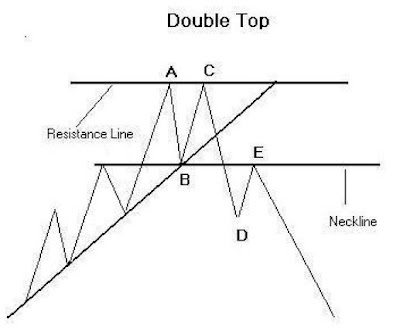
It is important that the neckline is broken on a closing basis as up until this point the market might merely be in consolidation. Once the neckline is broken you now have two choices. You can enter the market straight away or wait to see if the market returns to the neckline and test the newly formed resistance. I like to enter the market on a break and add to my position if the market does return to the neckline.
So now we have a break in the neckline and enter the market. Depending on the distance between B and C you can either place your stop loss order somewhere between B and C or above C if its not to expensive.

Tuesday, August 26, 2008 |
0 Comments
![]()
![]()
![]()
![]()
![]()
![]()
![]()
Forex Trading Online - 7 Reasons You Should
1 - Forex is the largest market.
Forex trading volume of more than 1.9 billion, more than 3 times larger than the equities market and more than 5 times bigger than futures, give Forex traders nearly unlimited liquidity and flexibility.
2 - Forex never sleeps!
You can execute forex trading online 24/7, from 7AM New Zealand time on Monday morning, to 5PM New York time on Friday evening. No waiting for markets to open: they're open all night! This makes Forex trading online a very attractive component that fits easily into your day (or night!)
3 - No Bulls or Bears!
Because Forex trading online involves the buying of one currency while simultaneously selling another, you have an equal opportunity for profit no matter which direction the currency is headed. Another advantage is that there are only around 14 pairs of currencies to trade, as opposed to many thousands of stocks, options and futures.
4 - Forex Trading online offers great leverage!
You can make the most of your investment resources with Forex trading online. Some brokers offer 200:1 margin ratios in your trading accounts. Mini-FX accounts, which can typically be opened with only $200-300, offer 0.5% margin, meaning that $50 in trading capital can control a 10,000 unit currency position. This is why people are flocking to Forex trading online as a way to highly leverage their investments.
5 - Forex prices are predictable.
Currency prices, though volatile, tend to create and follow trends, allowing the technically trained Forex trader to spot and take advantage of many entry and exit points.
6 - Forex trading online is commission free!
That's right! No commissions, no exchange fees or any other hidden fees. This is a very transparent market, and you'll find it very easy to research the currencies and the countries involved. Forex brokers make a small percentage of the bid/ask spread, and that's it. No longer any need to compute commissions and fees when executing a trade.
7 - Forex trading online is instant!
The FX market is astoundingly fast! Your orders are executed, filled and confirmed usually within 1-2 seconds. Since this is all done electronically with no humans involved, there is little to slow it down!
Forex trading online can get you where you want to go quicker and more profitably than any other form of trading. Check it out and see what Forex trading online can do for you!
About the author:
Keith Thompson is the webmaster of http://www.forex-trading-today.com,a site focusing on the latest Forex news and resources.
Tuesday, August 26, 2008 |
0 Comments
![]()
![]()
![]()
![]()
![]()
![]()
![]()
Tutorial - How to use candlestick pattern in forex trading. (Part 5)
Three Black Crows

Three White Soldiers

Doji
Bullish doji star

Bearish doji star

Evening star

Evening Doji star

Morning Star

Morning Doji star

Saturday, August 23, 2008 |
1 Comments
![]()
![]()
![]()
![]()
![]()
![]()
![]()
Tutorial - How to use candlestick pattern in forex trading. (Part 4)
Harami
Bearish Harami

Bullish Harami

Bearish Harami cross or Bearish Harami doji
A two day pattern similar to the Harami. The difference is that the last day is a Doji.

Bullish Harami cross or Bullish Harami doji
A two day pattern similar to the Harami. The difference is that the last day is a Doji.

Friday, August 22, 2008 |
0 Comments
![]()
![]()
![]()
![]()
![]()
![]()
![]()
GBP/JPY and GBP/USD Daily outlook
Tomorrow we have lots of fundamental news. I like to focus on JPY Trade Balance which is to be release at 7:50 am (GMT +8), Retail Sales (m/m ) which is to be release at 16:30 (GMT +8) and Philly Fed which is to be release at 22:00 (GMT +8).
From Japan, Trade Balance previous data is 0.14T and market is expect some good data which is 0.35T this month. Below is data for the last 3 month:

From UK we have some important news. Retail Sales previous data is -3.9% and the expected data this month is -0.3%. Below is data for the last 3 month:

Us session, we have Philly Fed which is forcast to be better than previous. Previous data is -16.3 and forcast data is -14.5. Description of Philadelphia Fed Manufacturing Index :
Measures the general business conditions of manufacturers in the Philadelphia Federal Reserve district. The index is derived from a survey that asks respondents to rate the level of general business activity as 'decrease', 'increase', or 'no change'. A rising trend has a positive effect on the nation's currency because good manufacturing conditions are a sign of a strong economy. Although this survey is limited to manufacturers in Philadelphia only, traders pay close attention because the Philadelphia Federal Reserve releases it weeks before other major reports on manufacturing (e.g., Industrial Production, ISM Manufacturing Index).
Thursday, August 21, 2008 |
0 Comments
![]()
![]()
![]()
![]()
![]()
![]()
![]()
Tutorial - How to use candlestick pattern in forex trading. (Part 3)
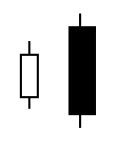
Bearish engulfing
Bullish engulfing

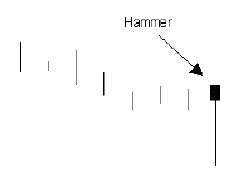
Hammer
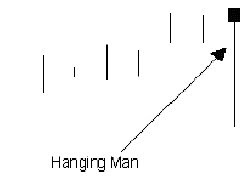
Hanging man
Identical in appearance to the hammer, but appears within the context of an uptrend.
Inverted hammer and shooting star
The inverted hammer and shooting star look exactly alike, but have different implications based on previous price action. Both candlesticks have small real bodies (black or white), long upper shadows and small or non-existent lower shadows. These candlesticks mark potential trend reversals, but require confirmation before action.

The inverted hammer looks exactly like a shooting star, but forms after a decline or downtrend. Inverted hammers represent a potential trend reversal or support levels. After a decline, the long upper shadow indicates buying pressure during the session. However, the bulls were not able to sustain this buying pressure and prices closed well off of their highs to create the long upper shadow. Because of this failure, bullish confirmation is required before action. An inverted hammer followed by a gap up or long white candlestick with heavy volume could act as bullish confirmation.
Thursday, August 21, 2008 |
0 Comments
![]()
![]()
![]()
![]()
![]()
![]()
![]()
GBP/JPY and GBP/USD Daily outlook

BoE Voted 7-1-1 to Leave Rates Unchanged, Besley Votes For Hike.
Cable continues to be bounded in choppy sideway trading above 1.8515 today and outlook remains unchanged. Consolidation should still be relatively brief as long as 1.0878 minor resistance holds and below 1.8515 will indicate that recent decline has resumed for next target of 100% projection of 2.1161 to 1.9337 from 2.0158 at 1.8360. However, above 1.8787 will indicate that a short term bottom is in place with bullish divergence condition in 4 hours MACD and RSI. Stronger rebound should then be seen to 38.2% retracement of 2.0158 to 1.8515 at 1.9413. Though, upside should be limited below 1.9541 resistance and bring fall resumption.

Focus is now on cluster support at 1.8303/60 (100% projection of 2.1161 to 1.9337 from 2.0158 at 1.8360 and 38.2% retracement of 1.3680 to 2.1161 at 1.8303). Sustained break of which will indicate that whole decline from 2.1161 is probably impulsive in nature and add more credence to the case of long term reversal. This will pave the way to next key support at 1.7047 first. On the upside, while strong rebound might be seen, a break of 2.0158 resistance is still needed to indicate fall from 2.1161 has completed. Otherwise, another fall should still be seen after correction.
Wednesday, August 20, 2008 |
0 Comments
![]()
![]()
![]()
![]()
![]()
![]()
![]()
Tutorial - How to use candlestick pattern in forex trading. (Part 2)
Falling Three Methods
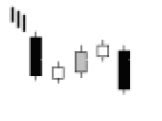 Rising Three Methods
 Doji
Doji
Dragon fly doji

The reversal implications of a dragon fly doji depend on previous price action and future confirmation. The long lower shadow provides evidence of buying pressure, but the low indicates that plenty of sellers still loom. After a long downtrend, long black candlestickor at support, a dragon fly doji could signal a potential bullish reversal or bottom. After a long uptrend, long white candlestick or at resistance, the long lower shadow could foreshadow a potential bearish reversal or top. Bearish or bullish confirmation is required for both situations.
Gravestone doji
Gravestone doji form when the open, low and close are equal and the high creates a long upper shadow. The resulting candlestick looks like an upside down "T" with a long upper shadow and no lower shadow.

As with the dragon fly doji and other candlesticks, the reversal implications of gravestone doji depend on previous price action and future confirmation. Even though the long upper shadow indicates a failed rally, the intraday high provides evidence of some buying pressure. After a long downtrend, long black candlestick or at support, focus turns to the evidence of buying pressure and a potential bullish reversal. After a long uptrend, long white candlestick or at resistance, focus turns to the failed rally and a potential bearish reversal. Bearish or bullish confirmation is required for both situations.
Long-legged doji
This line often signifies a turning point. It occurs when the open and close are the same, and the range between the high and low is relatively large.
 Tutorial Part 1
Wednesday, August 20, 2008 |
0 Comments
![]()
![]()
![]()
![]()
![]()
![]()
![]()


